 ForexRobotNation.com – Best Forex Robot & Expert Advisor Reviews Forex Robot, Expert Advisor
 EUR/GBP Price Long-Term: Bearish
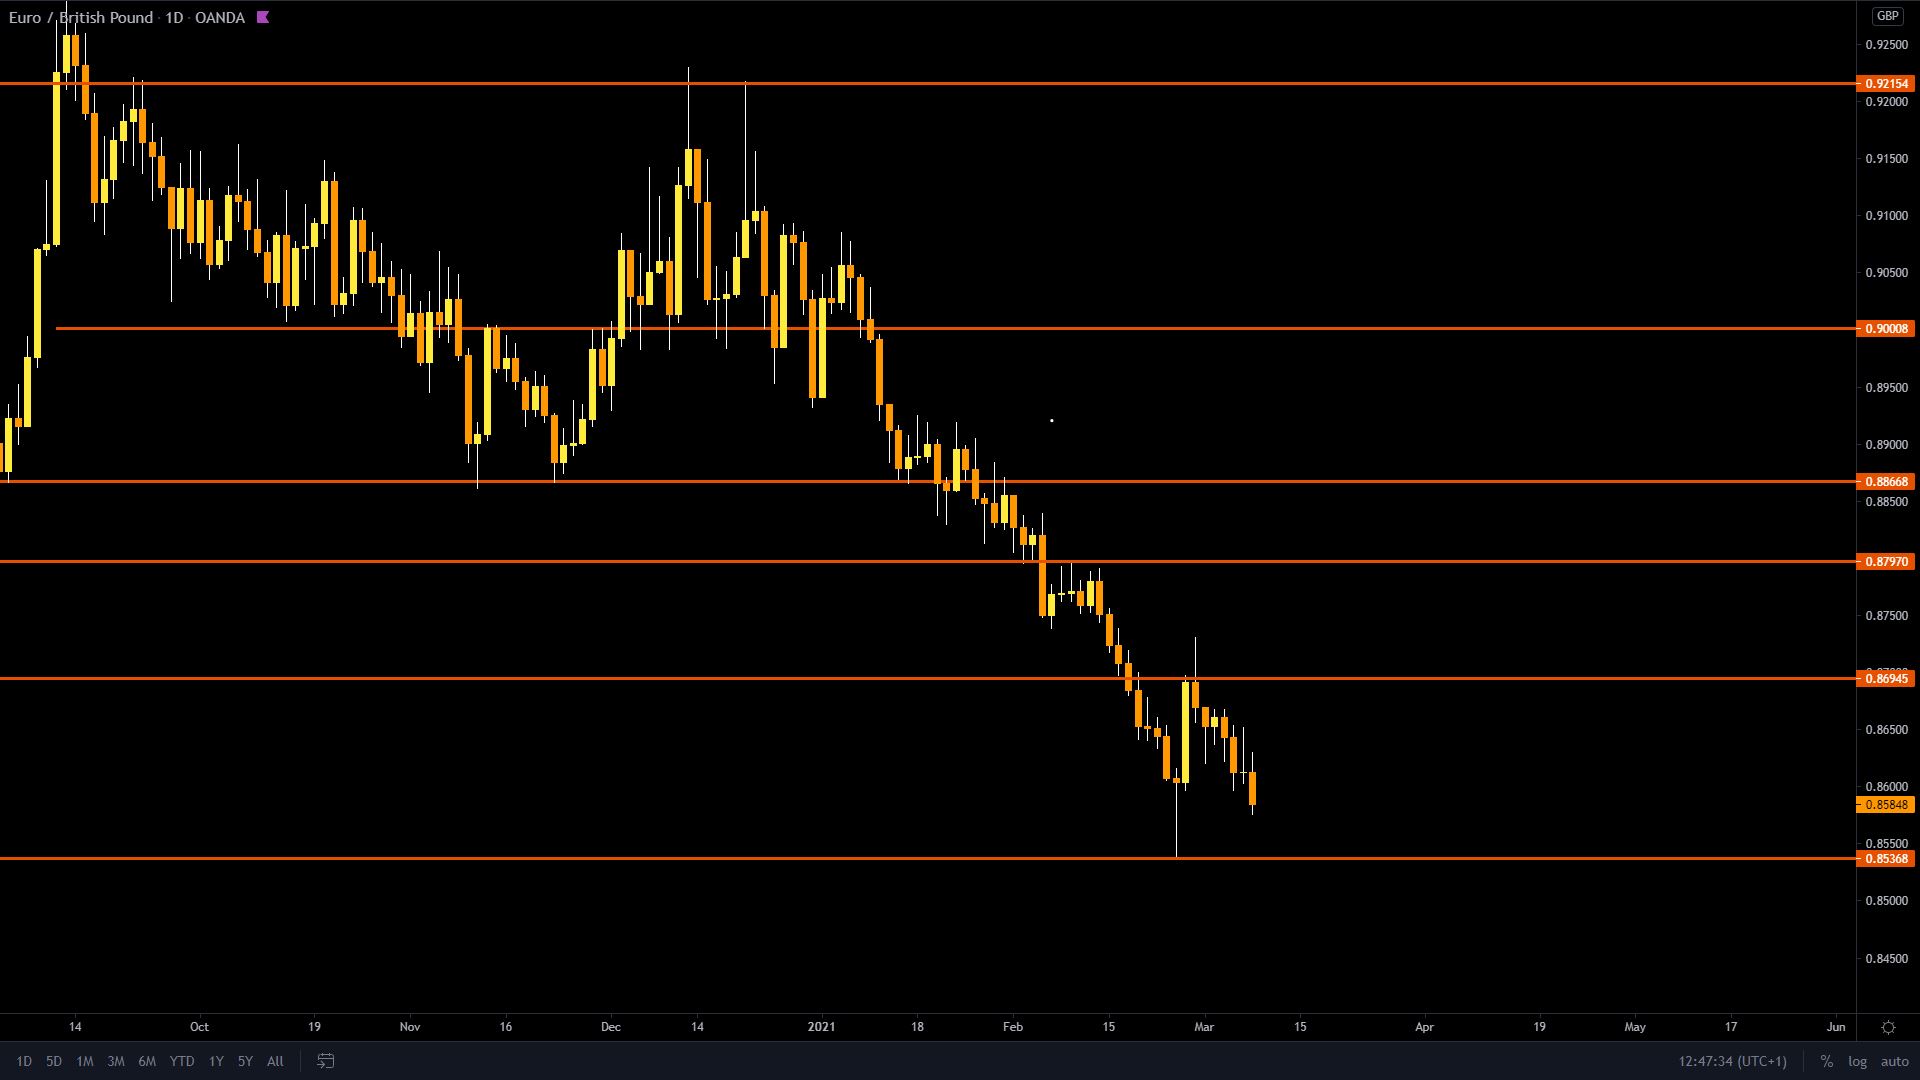
Key Resistance Levels: 0.8694, 0.8797, 0.8866
Key Support Levels: 0.8536, 0.8500, 0.8450
Daily Chart:
On the daily time frame, the price is in a strong downward movement where the sellers are obviously controlling the price of the EUR/GBP pair. The price posted lowers lows and highs which shows that the momentum is negative. We can conclude that the main direction of the trend is to the downside.
EUR/GBP Medium-Term Trend: Bearish

1-hour Chart:
On the 1-hr time frame, the price found sellers at the 61.8% Fibonacci retracement which led to a breakout of the flag formation to the downside. The pair posted a correction count to the lower end of this pattern with a doji candlestick with a big wick to the upside. Our expectation is a further movement to the downside toward the 0.8536 mark.
Signal Idea:
Sell Limit Order @ 0.8596
TP 1 @ 0.8536
TP 2 @ 0.8500
Stop Loss @ 0.8625
Trade Safely 🙂

hi when I saw the signal the pair was already under 0.8596. thr indication in this case is tp start immediately to sell or wait until the price reach 0.8596 and then place the sell order? thanks