 ForexRobotNation.com – Best Forex Robot & Expert Advisor Reviews Forex Robot, Expert Advisor
 Most Forex traders lose money, not because it’s a scam, but because nobody teaches it properly. I’ve been trading for 17 years, and this is the beginner’s guide to Forex Trading I wish I had when I started. If you actually understand what I’m about to share, you’re already ahead of most traders.
Trading has given me confidence, freedom to live on my own terms, and most importantly, time with my family. I’m not here to flash crazy numbers or sell you a dream. I’m here to teach you the right way.
Let’s get into it.
Contents
What Is Forex Trading?
Before we get into strategies and charts, you need to understand what you’re actually trading. The people who skip this part are the ones who struggle.
The Forex (foreign exchange) market is simply where currencies are bought and sold. Participants include retail traders like you, banks, and institutions — all exchanging one currency for another.
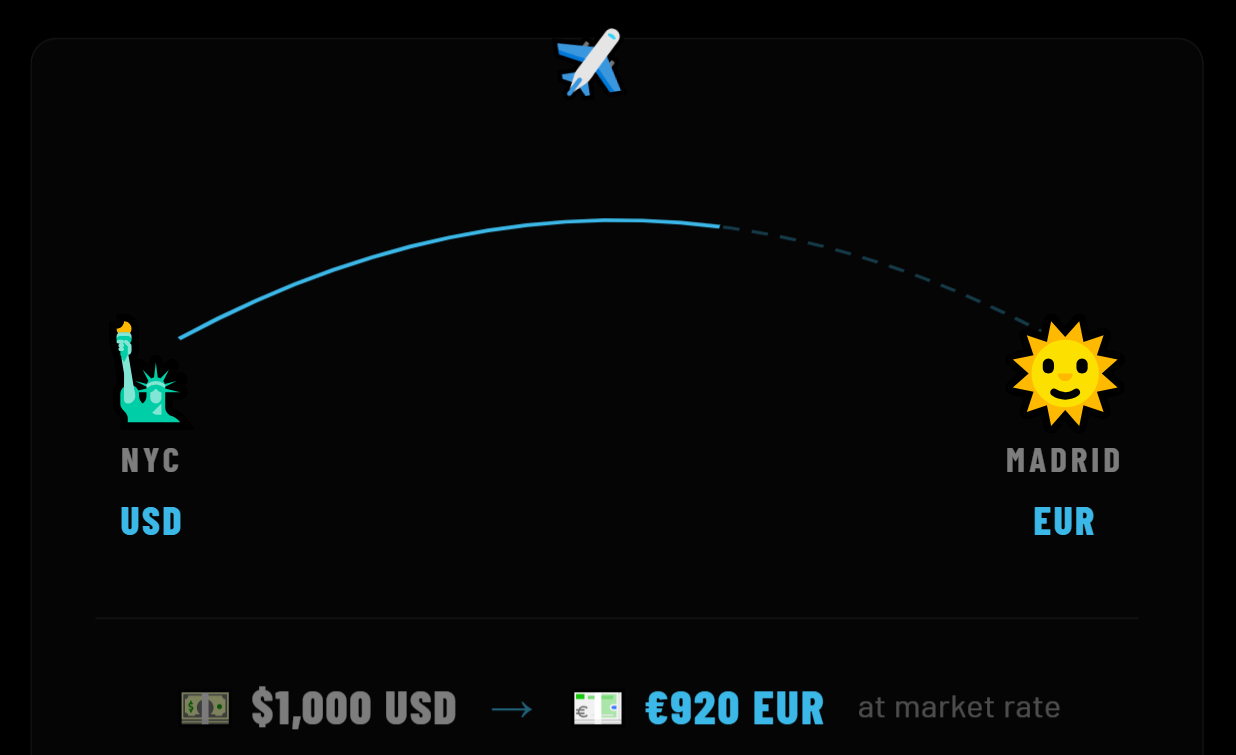
Here’s the thing: you’ve already traded Forex. Ever been on holiday and exchanged US dollars for euros? That’s it. That’s the market.
As traders, we profit by trading currencies in pairs — buying one and selling the other simultaneously. We make money on the movement in the exchange rate between them. Buy low, sell high. That’s the game.
Which Pairs Should Beginners Focus On?
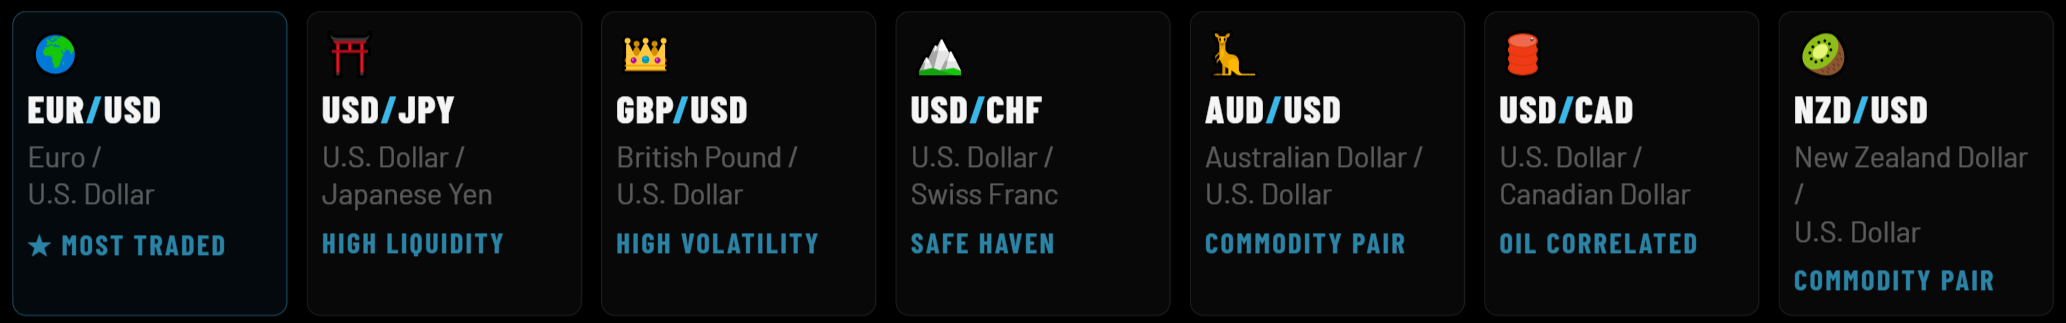
I recommend sticking to 7 major pairs, all of which include the US dollar. This makes them highly liquid and the easiest to trade. Don’t overcomplicate it at the start.
Key Terms to Know
- Bullish = price going up → you’re looking for buy trades
- Bearish = price going down → you’re looking for sell trades
You can profit whether the market is going up or down — as long as you predict it correctly.
Where and When Does Trading Happen?
Forex trades on the spot market — a decentralized network of banks, brokers, and dealers connected electronically. Unlike the stock market, you can trade anywhere, anytime.
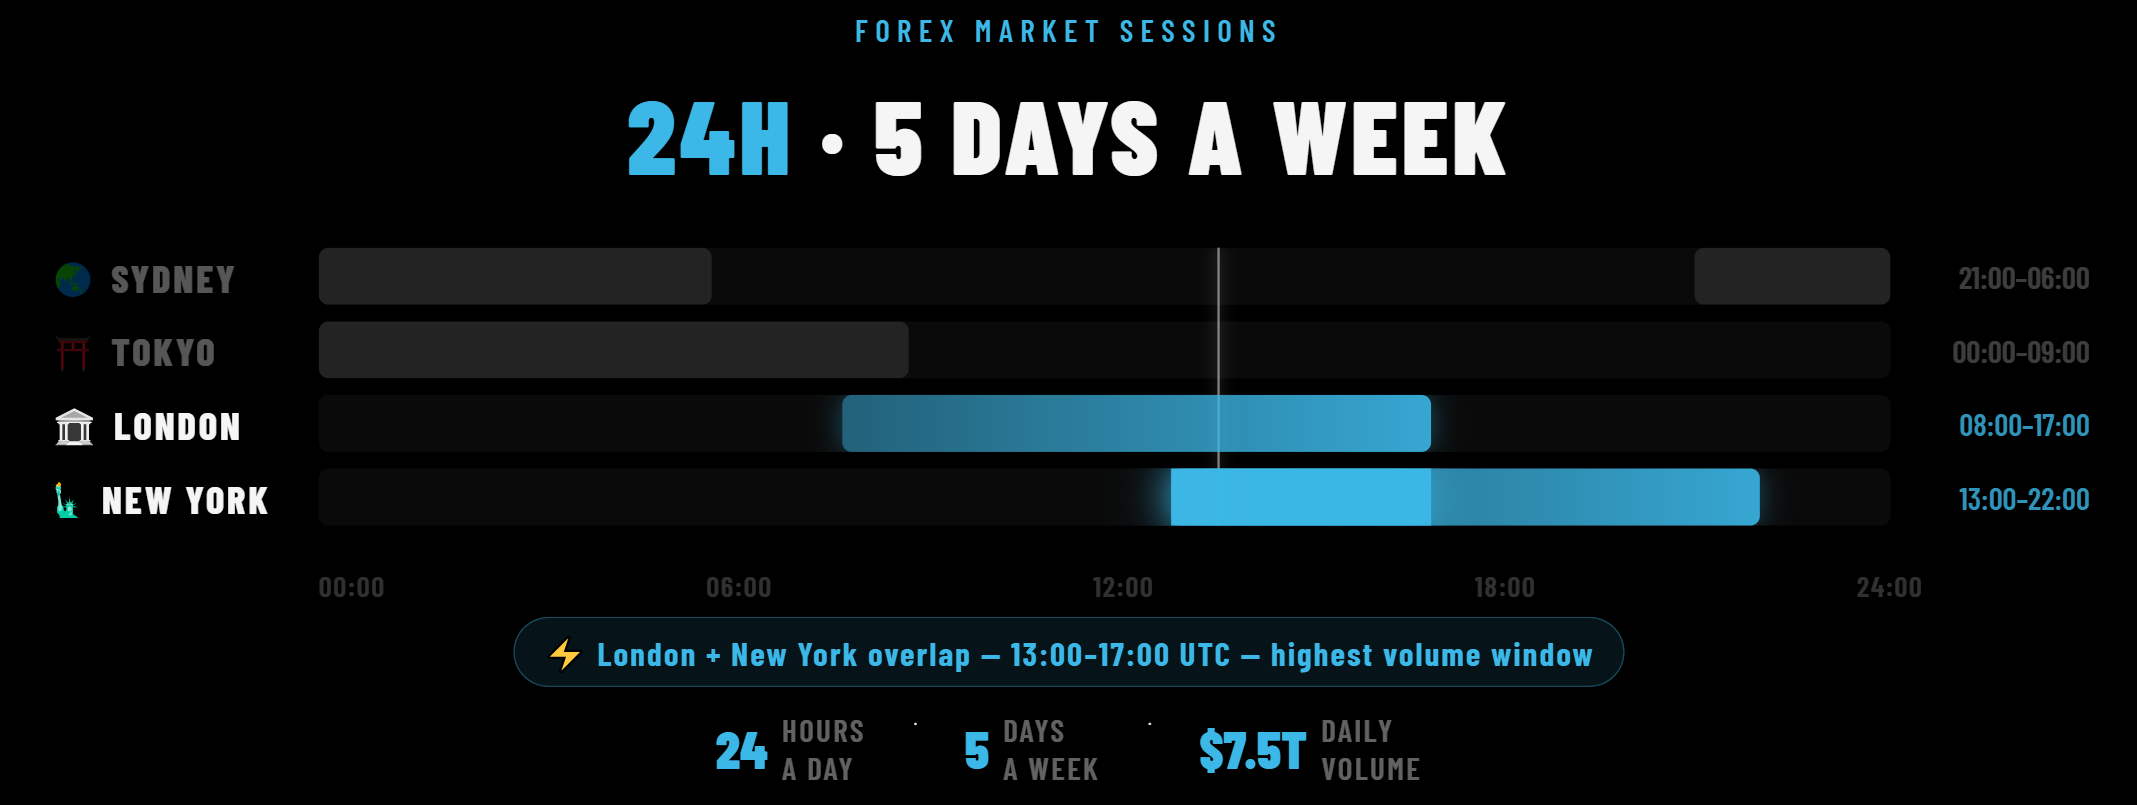
The market runs 24 hours a day, 5 days a week. The trading day rolls through time zones:
- Australia
- Tokyo
- London
- New York
Personally, I focus on London and New York — that’s where the highest trading volume is. I trade a little in the morning and get on with my day.
The Forex market moves $8 trillion per day. There’s enormous supply and demand in this market, which is the foundation of my trading strategies.
How Much Can You Actually Make?
Let me be real with you. Profit comes down to two things: how good you are and how much capital you have. But right now? Don’t think about profit. Focus on getting better.
“A bad month can’t crush you. It’s all about this year, trusting the process, and looking at your quarterly performance.”
Here’s how returns work in practice:
- A 5% return on a $10,000 account = $500
- A 5% return on a $100,000 account = $5,000
When starting out, set small goals. Can trading pay for groceries? Can it be a positive in your life? Start there.
The power of consistency is in compounding. A trader with $100,000 making a consistent 6% per month would double their money in 12 months. On a smaller account the numbers are smaller — but the principle is the same.
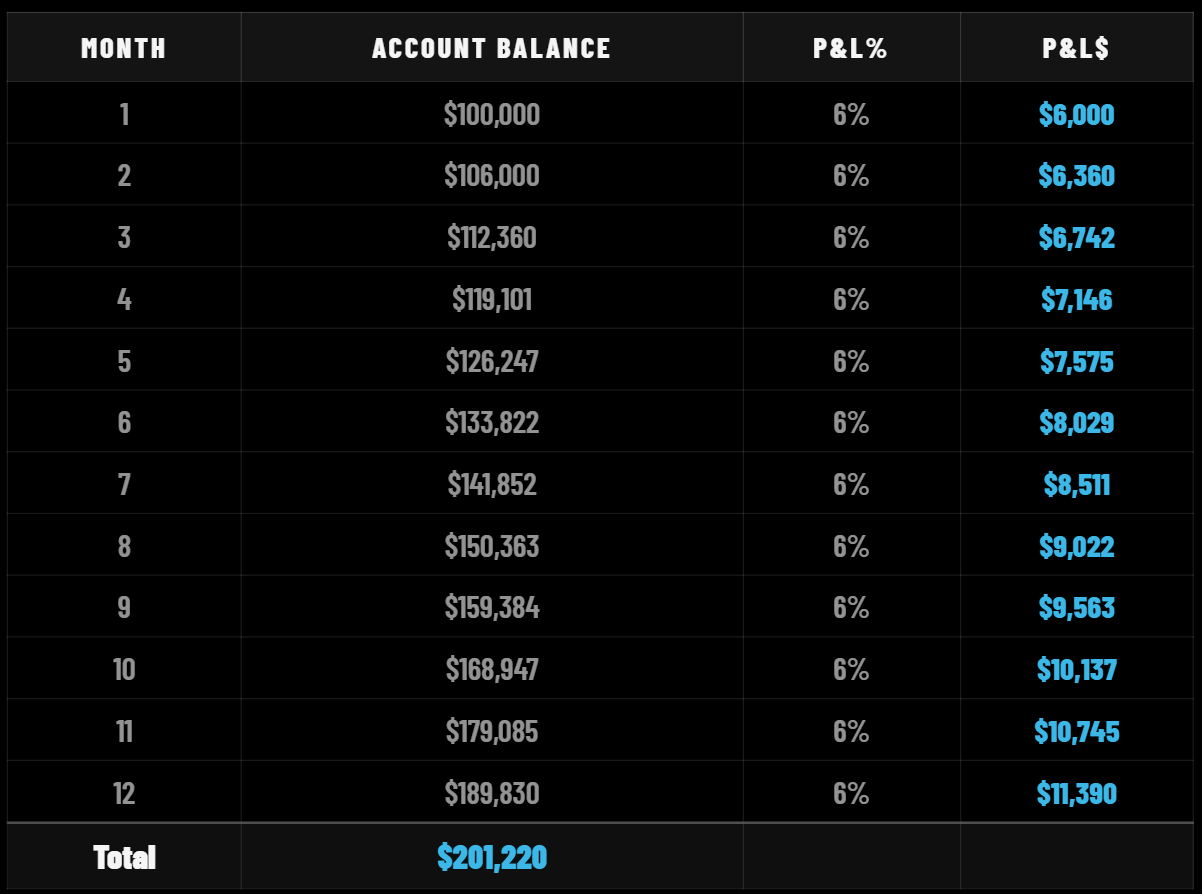
That said, 6% a month is far from guaranteed. Every trader, including me, goes through losing streaks and drawdowns. That’s not failure. That’s trading. That’s just part of the game.
Even hitting 20% in a single year is enough to live comfortably or at least make your life easier. Stop thinking like an employee and start thinking long-term.
Fundamental vs. Technical Analysis
There are two ways to analyse the market:
- Fundamental analysis — looking at interest rates, inflation, GDP. I keep an eye on this, but it’s not my main focus.
- Technical analysis — studying price charts, patterns, and structure. This is where almost all of my focus goes.
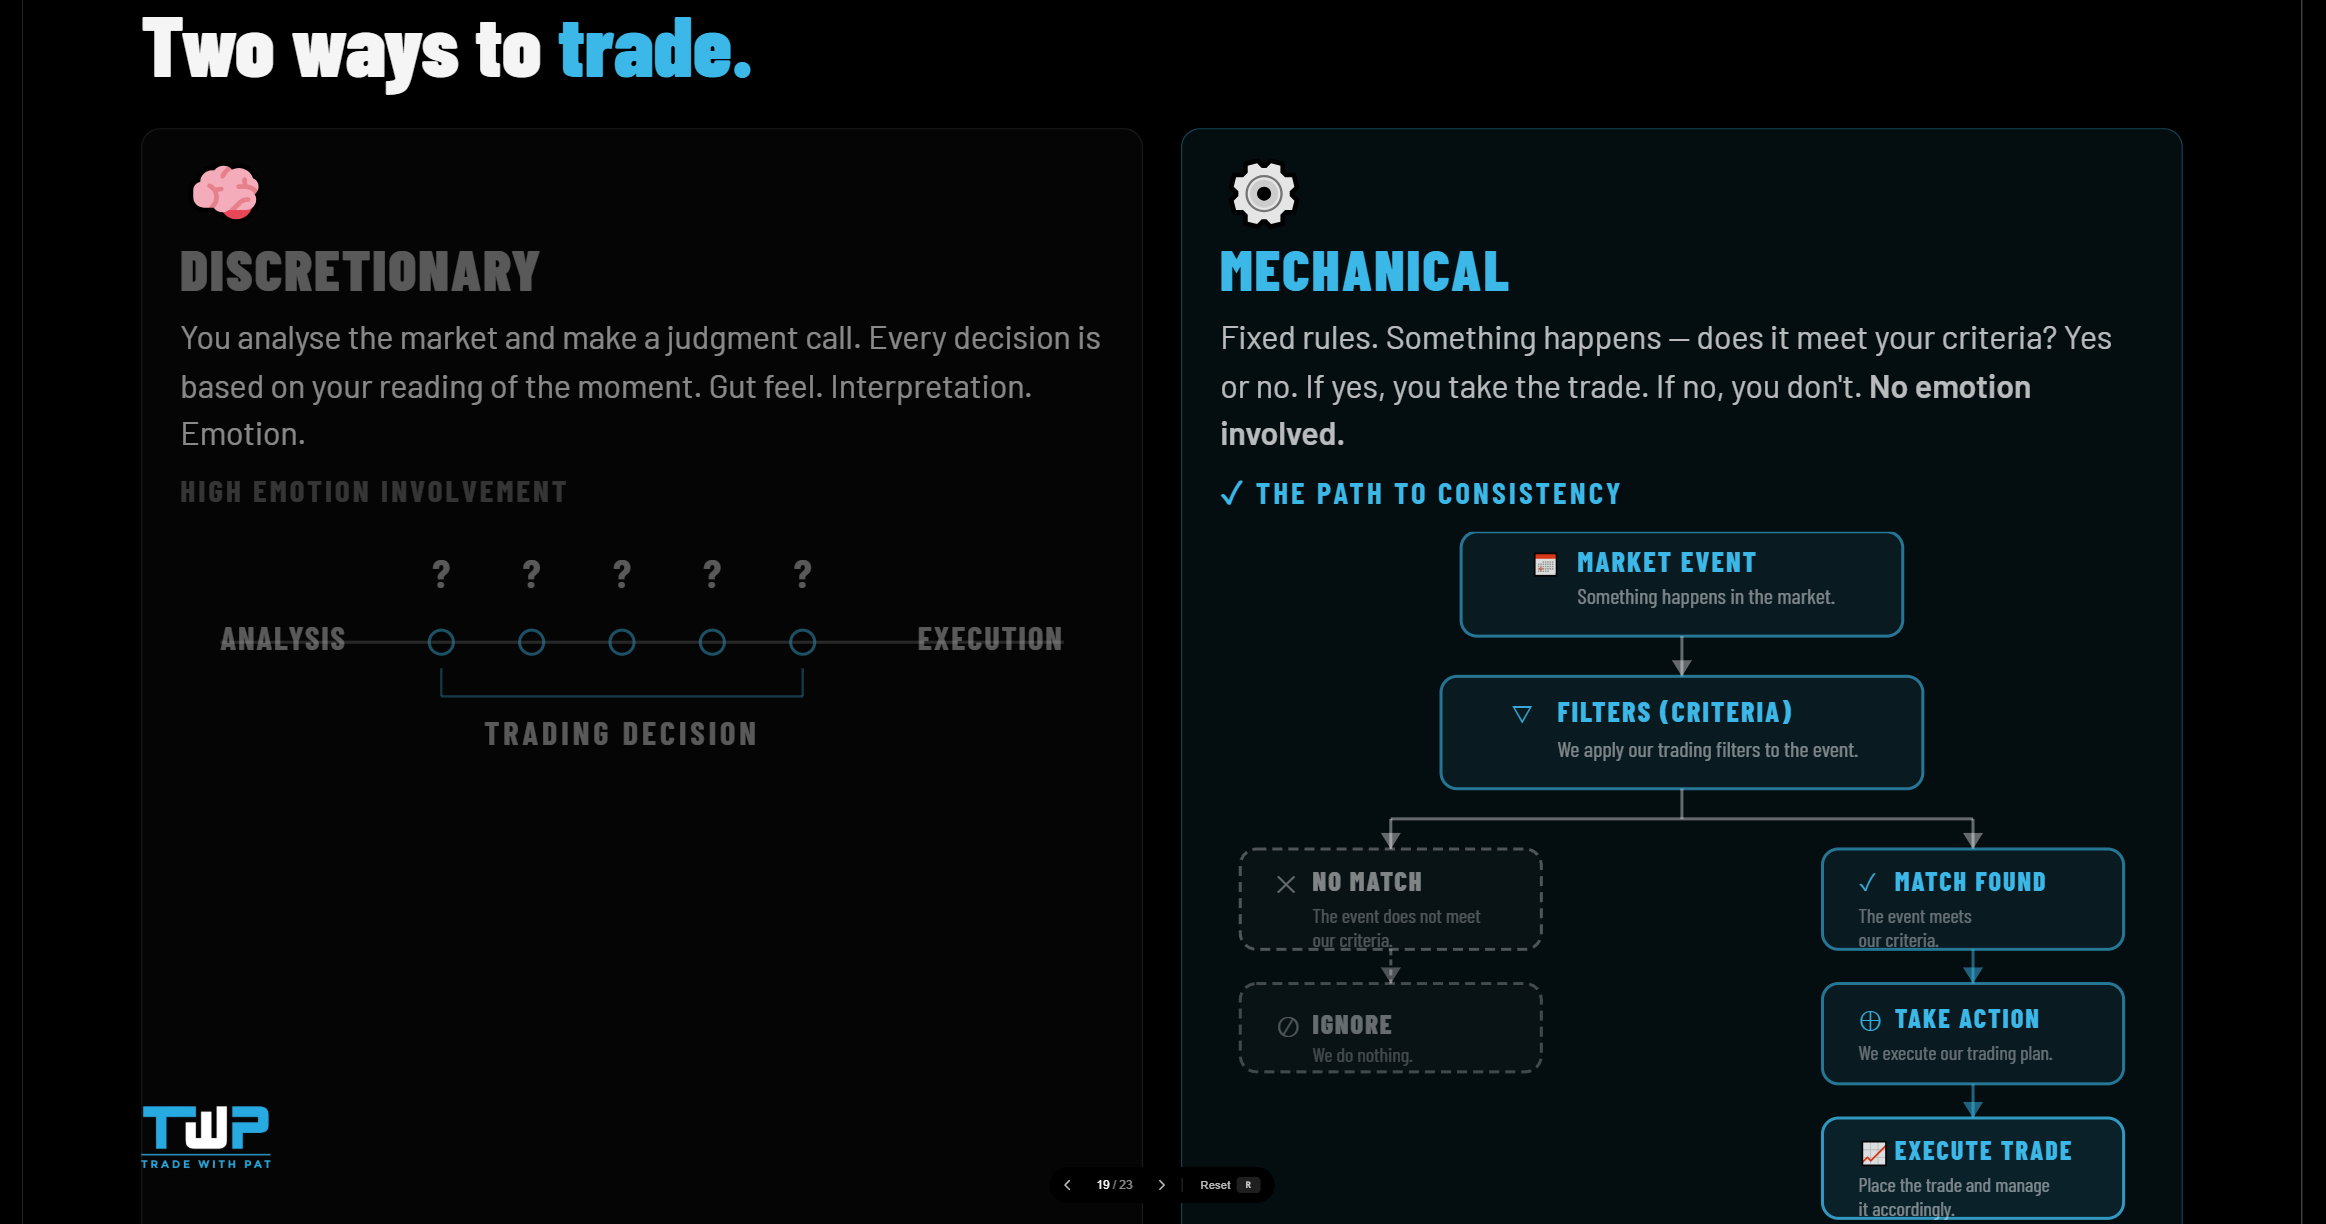
I also prefer a mechanical trading approach over a discretionary one. Instead of going on gut feel, I follow a clear system with rules that must be met before I place a trade. Trading can be simple. Execution is the hard part.
The four steps to building your edge:
- Find your edge
- Back test it
- Execute consistently
- Scale up and take advantage of compounding gains
Understanding Candlestick Charts
Everything in technical analysis starts with reading candlestick charts. Each candle tells you four things:
- Open — where price started
- Close — where price ended
- High — the highest price during that candle
- Low — the lowest price during that candle
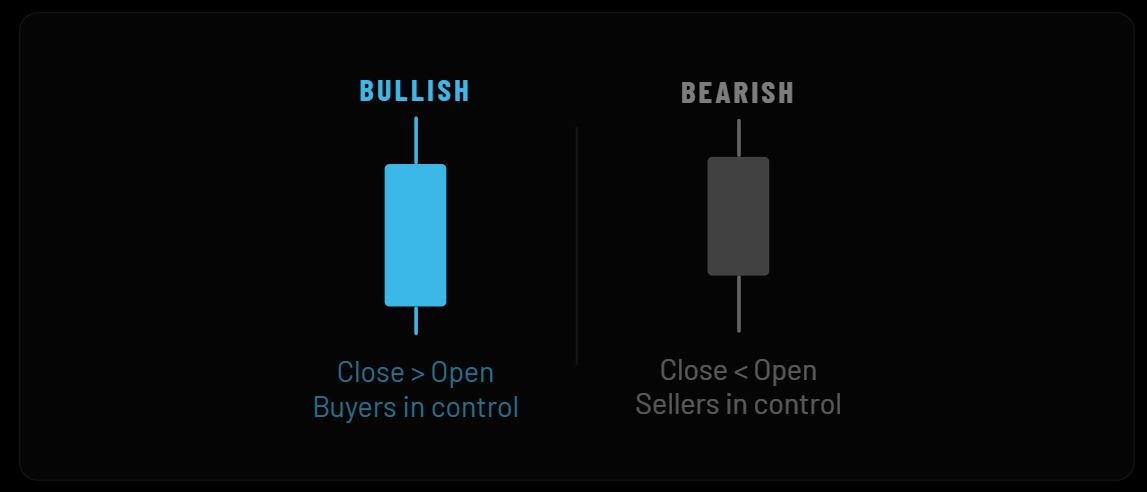
- A green (bullish) candle = price closed higher than it opened
- A red (bearish) candle = price closed lower than it opened
- The wicks (thin lines above/below the body) show the highest and lowest prices hit during that period
Each candle represents a time frame. On a 4-hour chart, every candle = 4 hours of price action. On a daily chart, each candle = one full day.
I recommend using TradingView — it’s free and everything I’ll show you below is done there.
Strategy 1: Day Trading & Swing Trading (Supply & Demand)
This is my bread-and-butter strategy, and it works on any time frame. Here it is in three steps.
Step 1 — Identify Supply & Demand Zones
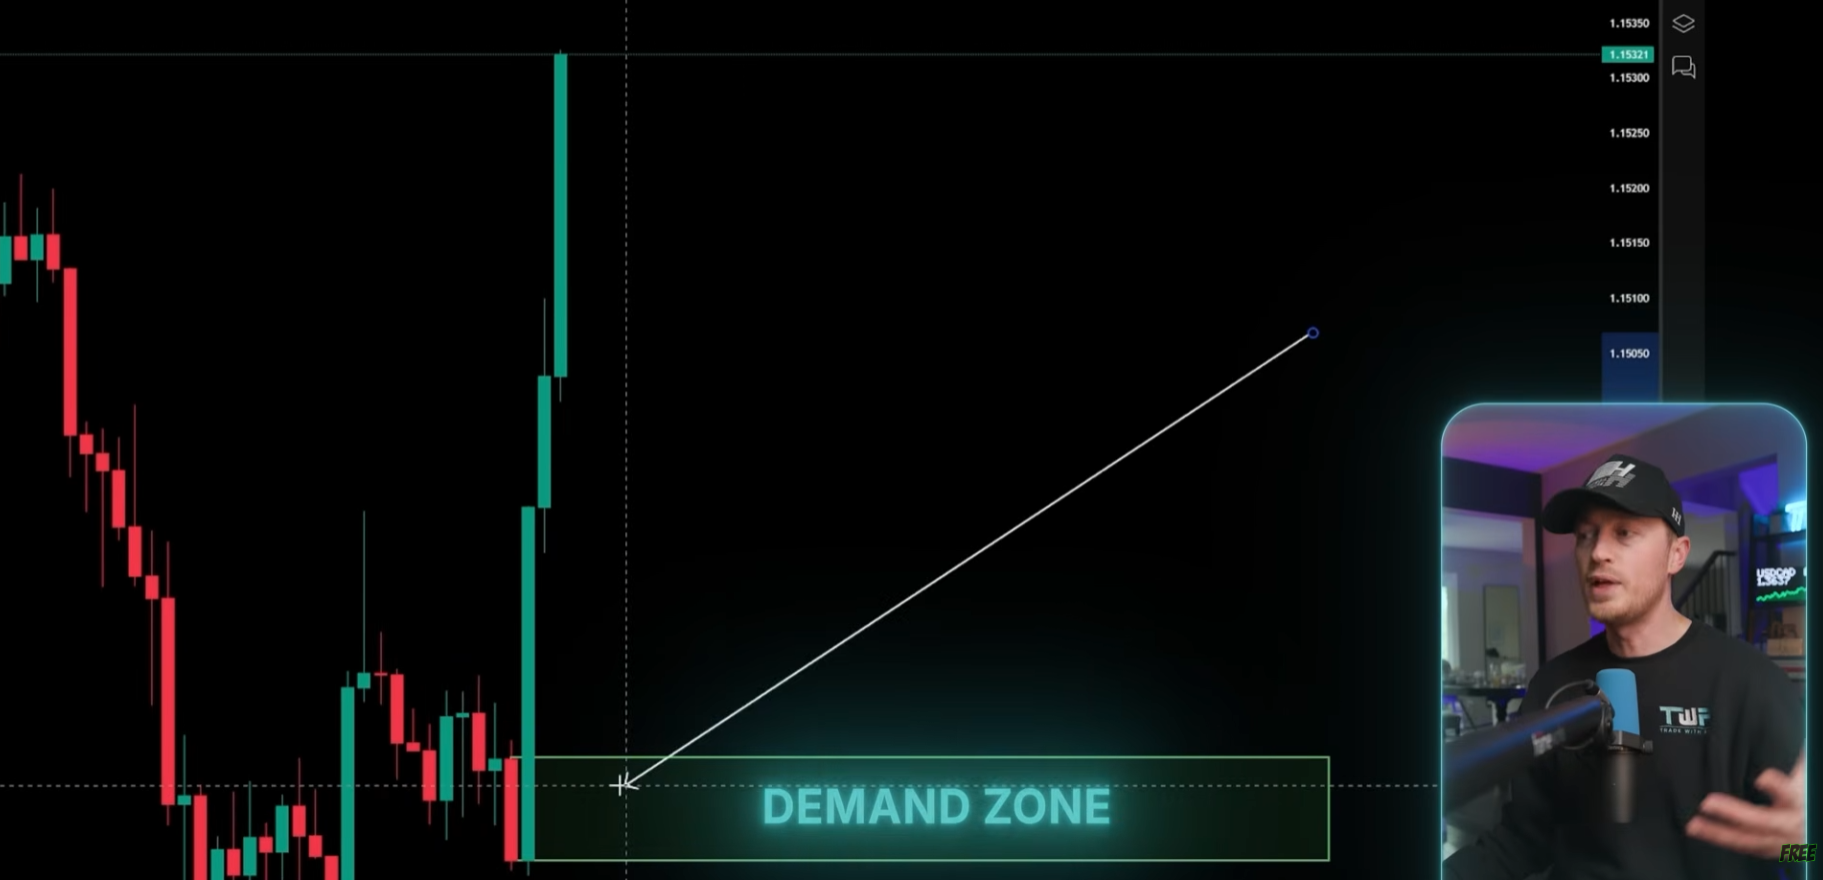
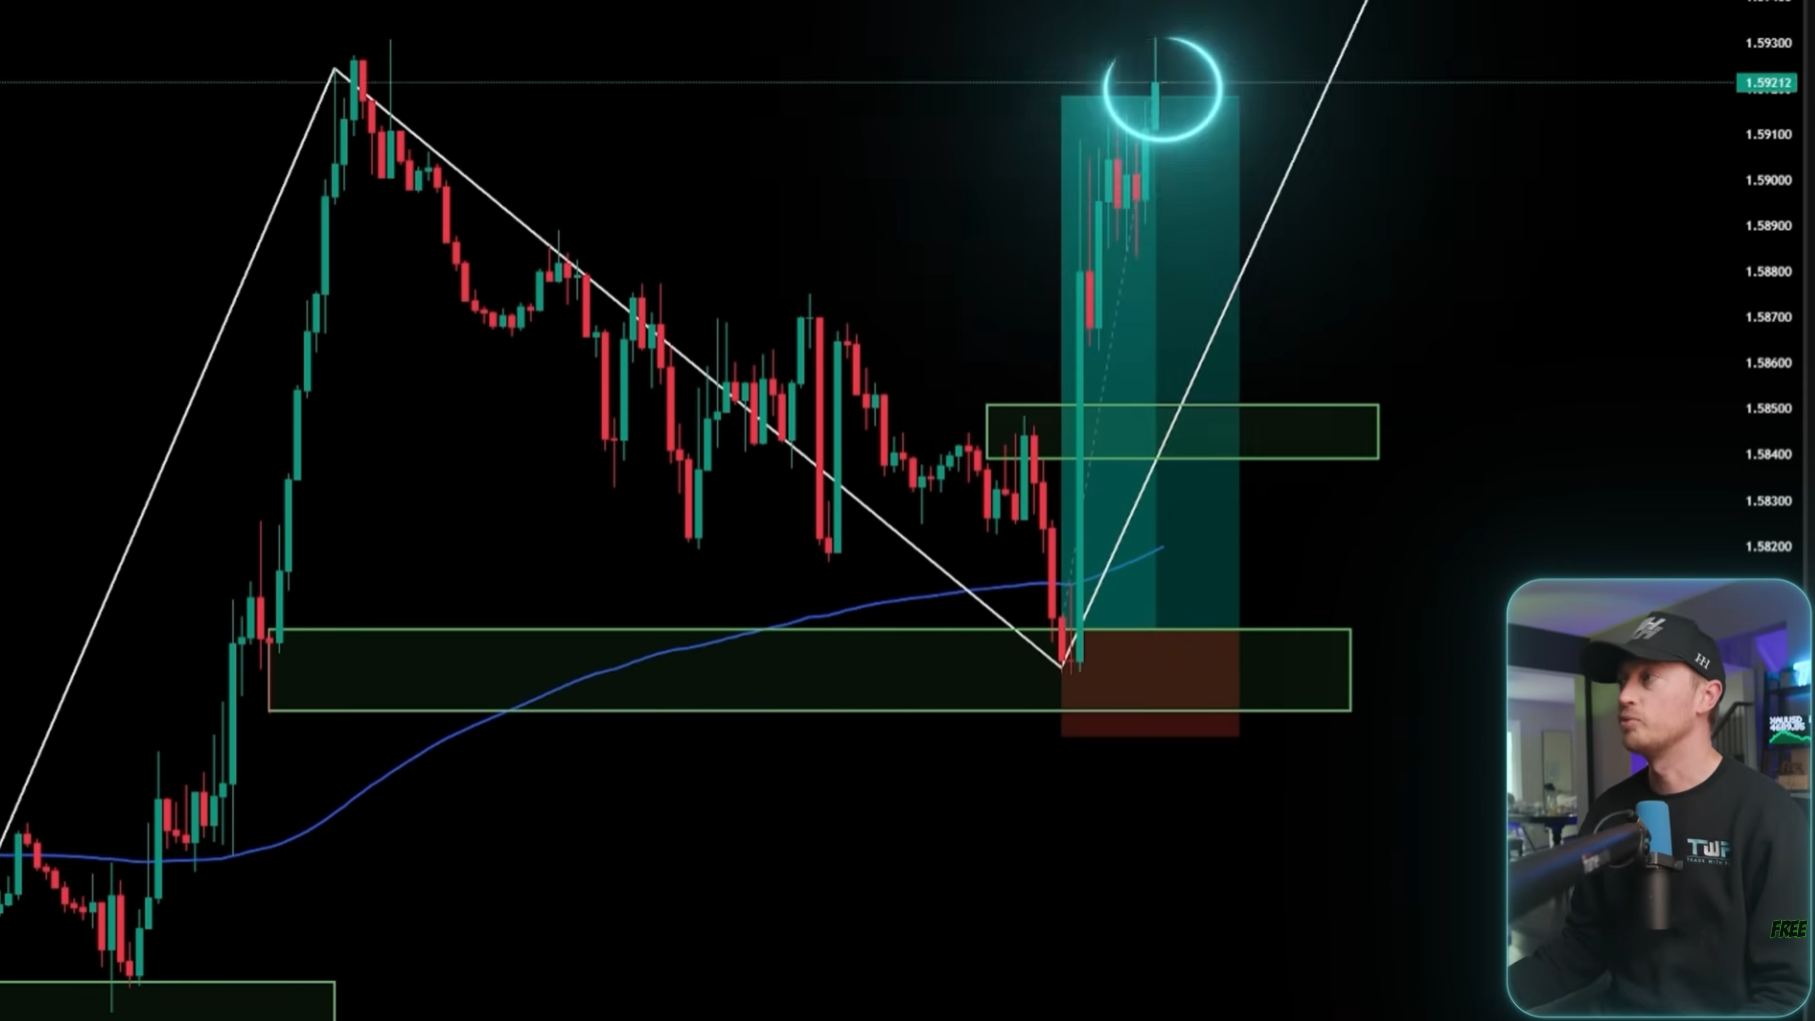
I’m looking for a huge push in price — think two or three big green candles in a row covering 50–75+ pips. A move that large represents billions of dollars in institutional flow. Real money. Not retail traders.
To mark out the demand zone, I find the red candle just before the big push up and mark out the candle body. That level tells me where the banks and institutions were buying. If they liked that level, I like it too.
I also look for Fair Value Gaps (FVGs) — a three-candle pattern where price moves so aggressively that the wicks of the surrounding candles don’t overlap the body of the middle candle. This imbalance signals that buyers had so much strength off a level that sellers couldn’t pull price back even slightly. Multiple strong FVGs = a stronger demand zone.
Step 2 — Confirm the Trend
Always trade with the trend. I identify the trend by marking swing points:
- An uptrend = higher highs and higher lows
- A downtrend = lower lows and lower highs
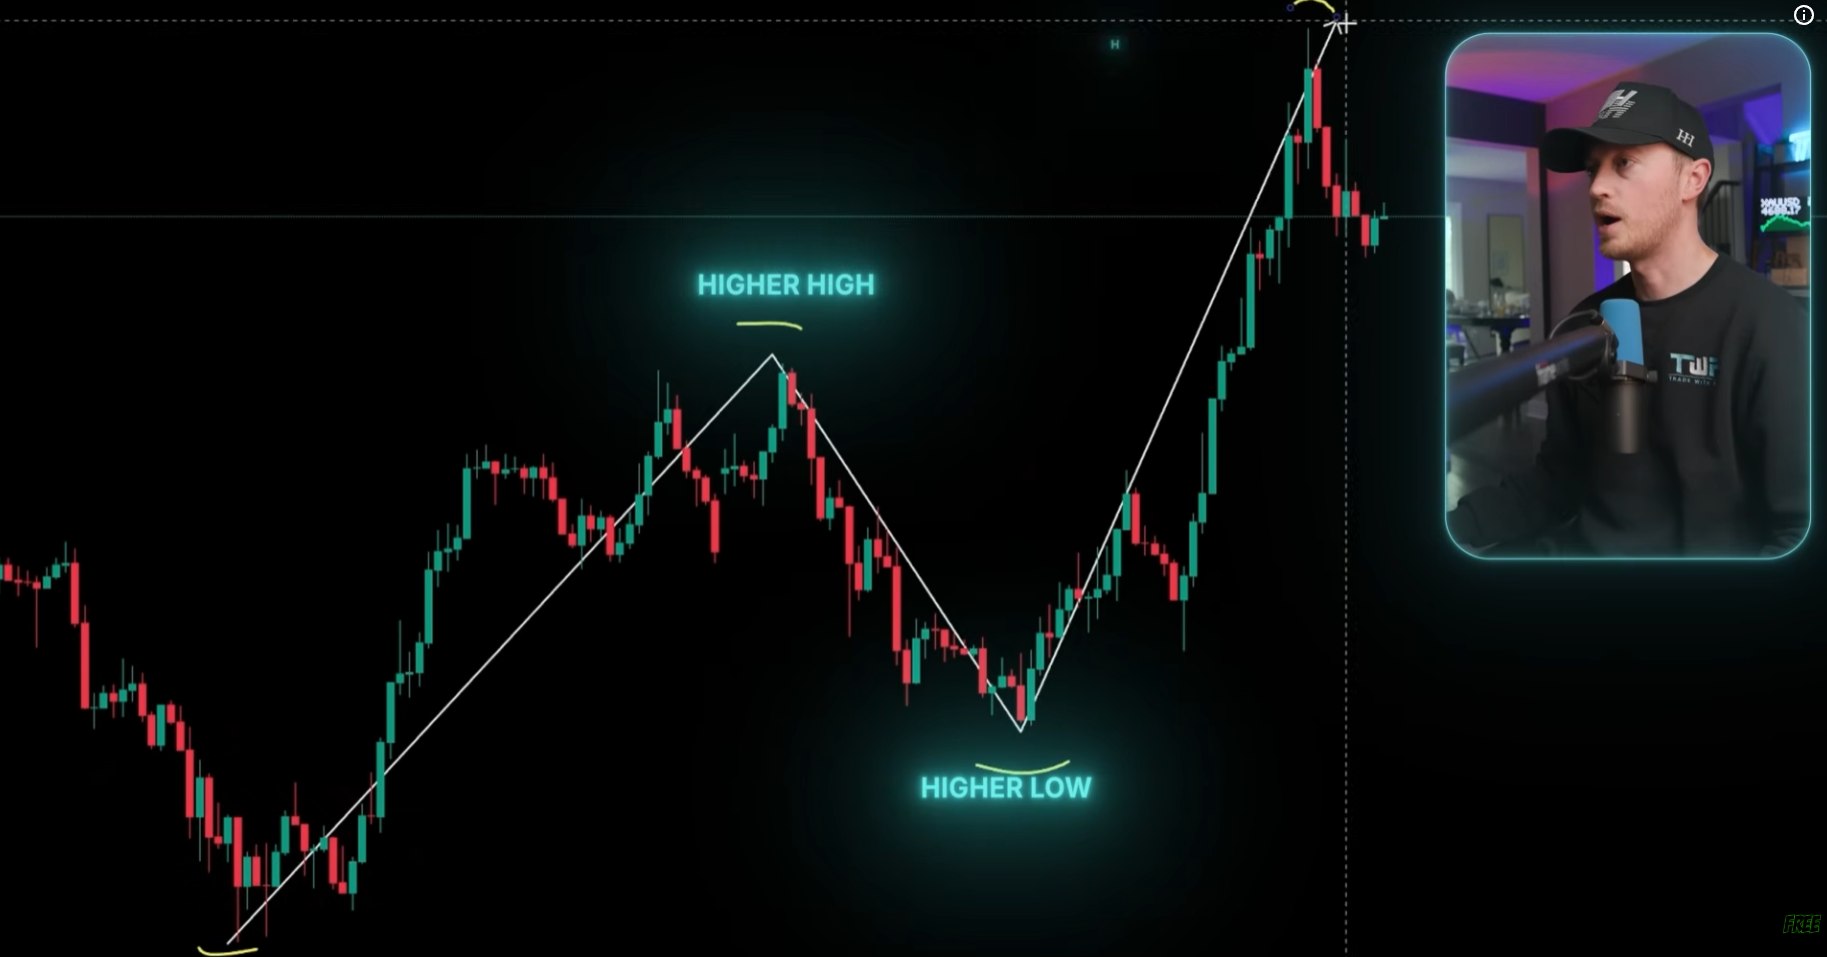
As long as price doesn’t break below the most recent swing low, the uptrend is intact and I’m looking for buys.
I also use the 200-period EMA as extra confirmation. When price breaks aggressively above the EMA and gets some separation from it, I’m even more confident the uptrend will continue.
Step 3 — Enter the Trade
Once I have a demand zone identified and the trend confirmed, I wait for price to pull back to that zone.
- Entry: I set a limit order at the demand zone. If price approaches slowly, I enter immediately. If you want extra confirmation, wait for a green candle to close at the level first (slightly worse risk/reward, but that’s fine).
- Take profit: I target the nearest level of resistance, a previous high where price has rejected multiple times.
- Stop loss: Below the demand zone, sometimes below the 200 EMA for a little extra cushion.
Once price passes a key level, I’ll often move my stop loss to break even, making it a risk-free trade. This is the strategy I’ve been using for over a decade.
Strategy 2: Scalping with Open Range Breakouts
Scalping is fast. Smaller time frames, lots of action, more difficult, but extremely rewarding when done right. This is done in three steps and is timed around 9:30 AM New York Stock Exchange open.
Step 1 — Mark the Opening Range
On TradingView, add the Lux ALGO Opening Range indicator. Set it to 15 minutes, 9:30–9:45 AM (UTC-4). This marks the high and low of the first 15 minutes of the NY session, your opening range.
Step 2 — Wait for Displacement
I’m not just waiting for any break of the range, I’m waiting for an aggressive break and close outside the range. This “displacement” means price moved forcefully, creating a demand zone and a fair value gap, just like in the day trading strategy. A weak, slow break doesn’t count.
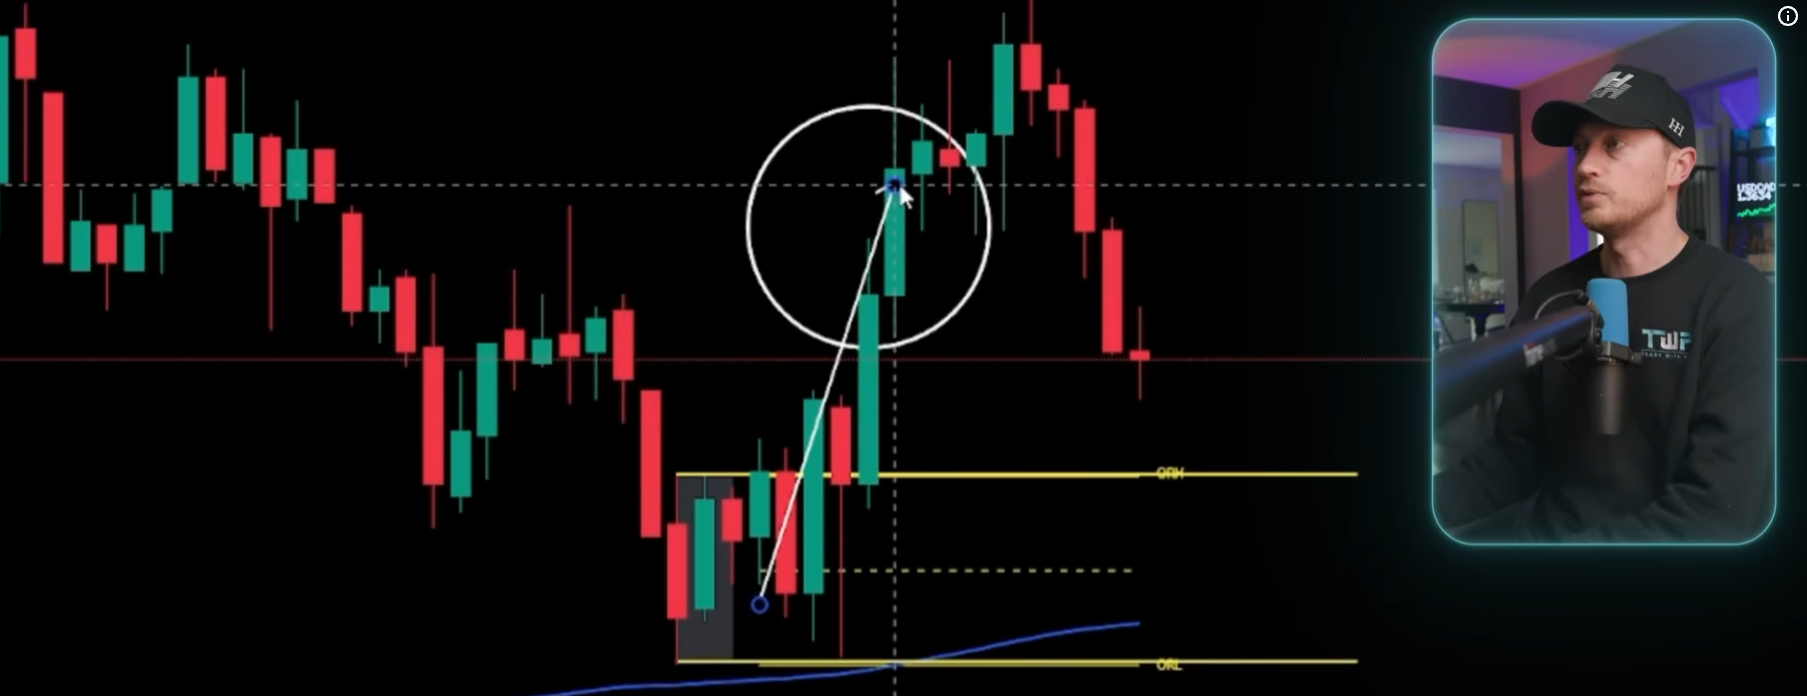
Step 3 — Enter on the Pullback
- Entry: After the aggressive breakout, wait for price to pull back to the top of the opening range. That’s your entry level.
- Take profit: The nearest level of resistance where price has rejected previously.
- Stop loss: Below the bottom of the opening range (price tested that level twice, so it’s meaningful).
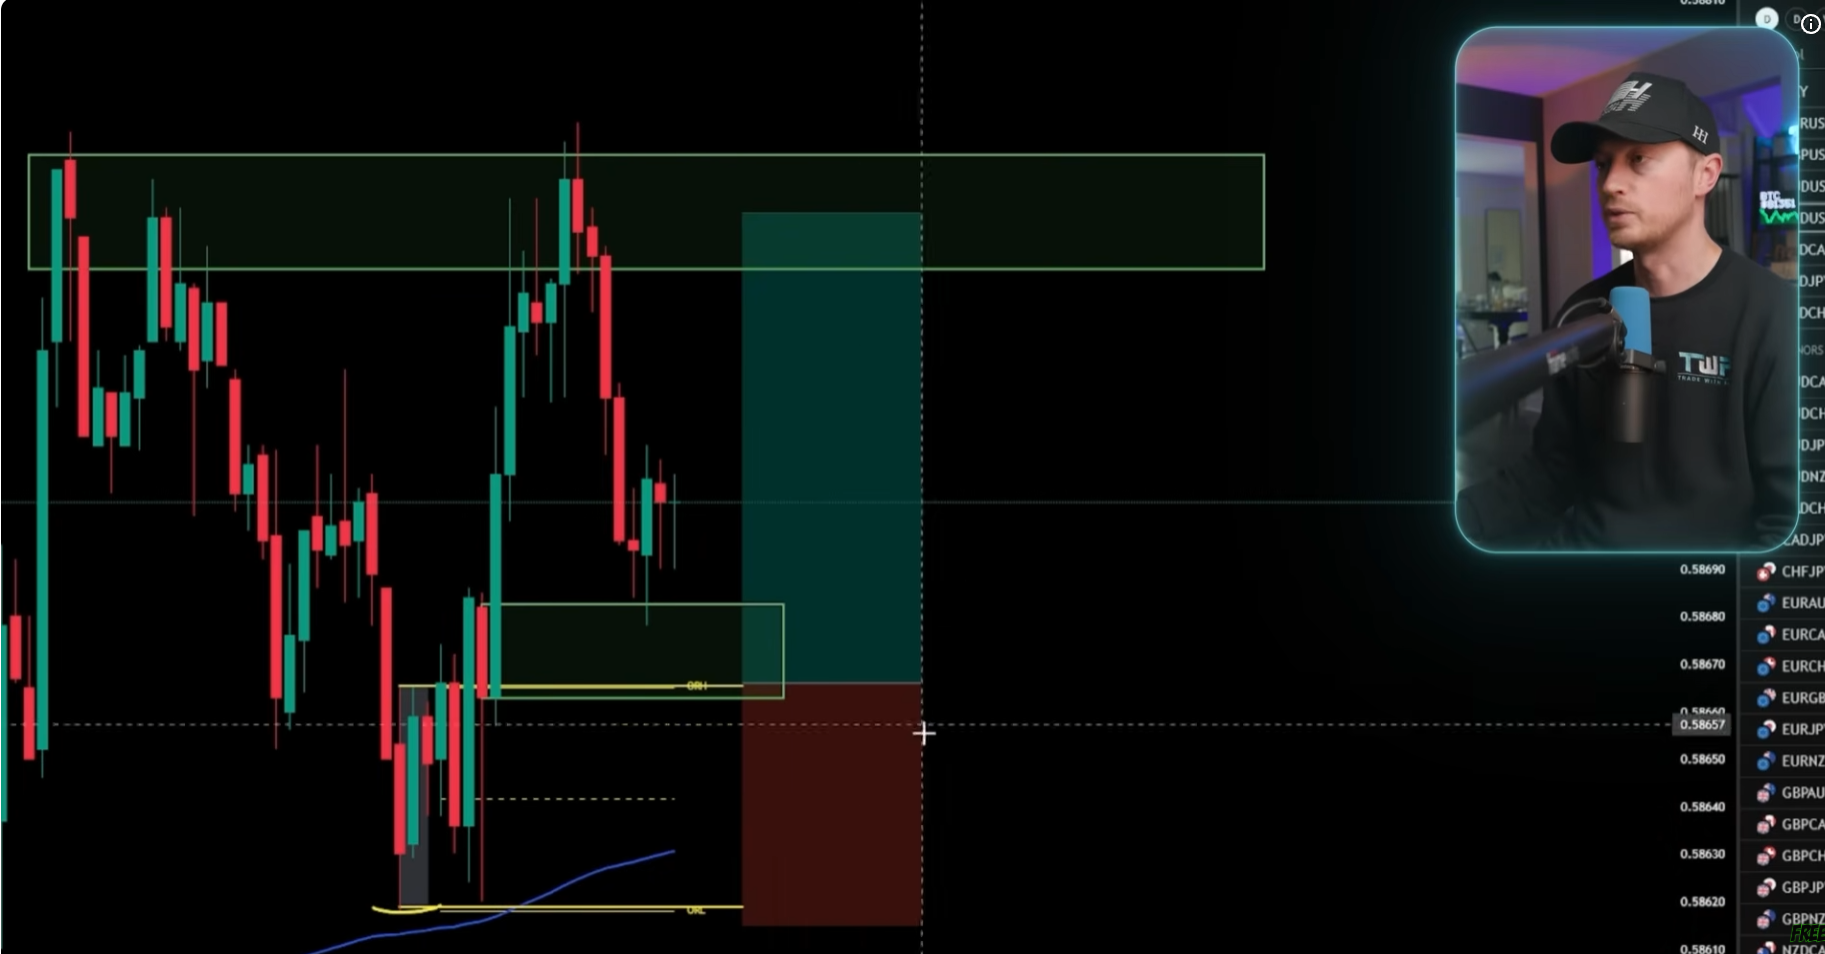
Use the 200 EMA and swing structure to confirm you’re trading with the trend — and make sure you have as much confluence as possible. Scalping is fast and people blow accounts doing it without a system.
How to Practice: Back Testing on TradingView
Before you risk real money, use TradingView’s Chart Replay feature. Pull the chart back in time, slowly play it forward candle by candle, and ask yourself: “What would I do right now?” Write down your decisions. Check if your rules were met. Track your results.
This is how you develop and validate your trading strategy without losing a penny.
Final Thoughts
Forex trading isn’t magic, but it’s also not as complicated as most people make it. Strip it back and it’s this: buy low, sell high. Know when a currency is undervalued or overvalued and position yourself accordingly.
The two strategies above, supply & demand day trading and open range breakout scalping, are all you need to get started. Here’s your action plan:
- Open a free TradingView account
- Start on a demo account — no real money yet
- Back test these strategies using Chart Replay
- Track every trade in a journal
- Only move to live trading once you’re consistently profitable on demo
The market isn’t going anywhere. Take your time, build your skills, and let compounding do the work.
Have questions? Drop them in the comments below. And if you found this helpful, share it with someone who’s been thinking about getting into Forex.
